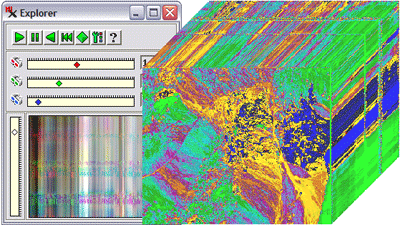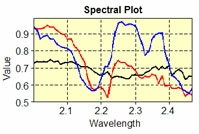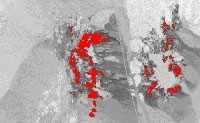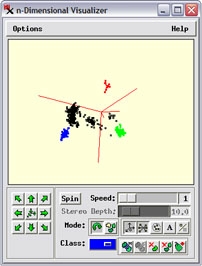
The Hyperspectral Analysis process in TNTmips provides the specialized tools you need to fully exploit the spectral range and spectral resolution of your hyperspectral images. On-the-fly reflectance calibration and an integrated spectral library make the process easy to use, yet it also includes powerful tools for data reduction, spectral search, and spectral mapping. You can extract and archive spectra from your image and import your own field or laboratory reflectance spectra. Your hyperspectral images can be imported or converted to a single compressed hyperspectral object for efficient storage, use, and processing.
See also:
Tech Guides on Hyperspectral Analysis,
Hyperspectral Analysis tutorial.


Hyperspectral Analysis Highlights
- Work with hyperspectral images from any sensor (AVIRIS, ENVI, and AISA formats)
- Store hyperspectral images in hypercube form (lossless compressed using vector quantization) for efficient display and analysis
- Hyperspectral Explorer tool allows rapid selection of an informative 3-band set for color display
- 3D hypercube display with choice of band to display on top and choice of optional color palette
- On-the-fly calibration to reflectance using equal area normalization or flat field correction
- Work with the entire image band set or choose a wavelength range subset for analysis
- Integrated USGS spectral library with over 500 mineral spectra
- Extract spectra from image, import your own laboratory spectra, save in custom spectral libraries
- Search any spectral library for matching spectra
- Integrated spectral plots from image or library spectra
- Integrated data reduction using Principal Components analysis or Minimum Noise Fraction Transform
- Identify spectral end-members using pixel purity index and n-Dimensional Visualizer
- Image classification using spectral angle or self-organizing map classifiers
- Subpixel spectral mapping using linear unmixing or matched filtering
- Remove continuum from individual spectra or the entire image
